MVC normalization is a commonly used amplitude analysis technique on EMG signals. This post-processing method utilizes a maximum root mean square (RMS) value from a recording to normalize subsequent EMG data series. The output is displayed as a percentage of the MVC (%MVC) value, which can be used to easily establish a common ground when comparing data between subjects.
EMG signals have a user-dependent nature, causing recordings to differ even when measuring from the same location with the same motion. Therefore, a MVC normalization can be used in order to eliminate this variance and allow for data comparison between subjects to take place.
This step-by-step blog will detail how to perform such a technique using EMGworks Analysis software and its built-in calculation tools, EMGscripts.
MVC Normalization Instructions:
- Open EMGworks Acquisition and setup your test configuration (sensors, test operator/subject). If you are unsure on how to do so, details can be found here.
- Within your configuration, there will be a toolbar on the left side of the program window. Select the Experiment Workflow header.
- In order to perform the normalization you will need at least (2) Plot and Store templates.
- MVC trial
- Any number of subsequent EMG trials (to be normalized)
Note: as long as you have a MVC trial any other EMG runs can be normalized, not just those recorded alongside the MVC trial.
- Set the Plot and Store run time and names accordingly. Typically, MVC run times are short as they only require a maximum contractile force to be reached.
- Proceed and run the test configuration.
- In order to reach ones maximum contraction, a resistance which works against the force of the muscle contraction is required. In many cases, a limb’s motion can restrained to produce a MVC.
- Run and record any additional trials you may have.
- Open EMGworks Analysis and import the MVC trial with all the runs you wish to normalize into a workspace.
- Highlight the run(s) you wish to normalize in the Data window, located on the left side of the program.
- Right-click within this window and navigate to Calculation Scripts → Amplitude Analysis.
- In the parameter window, check off Normalize Data and select your normalizing series as the MVC trial.
- This EMGscript then performs an RMS computation on the input data and normalizes it against the peak RMS value of the MVC trial.
- Select OK and the calculation will run in the background, appearing in the Data window when finished.
- Plot the MVC normalization by selecting and right-clicking the series you wish to view. You have the options to plot these separately or as subplots.
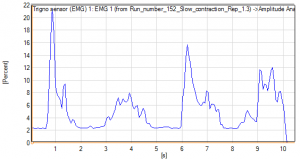
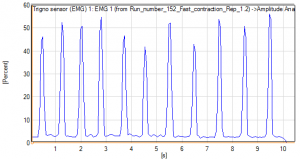
- The output plots produced are displayed in %MVC versus time.
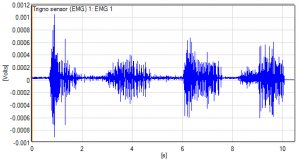
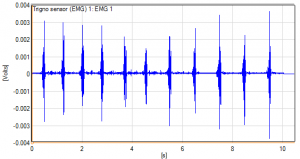
- MVC plots versus the corresponding raw EMG signals:


