The root-mean-square (RMS) envelope of the EMG signal is calculated using a moving window, with each window of data calculated according to the following equation: ,
where S equals the window length (points) and f(s) equals the data within the window.
The RMS calculation is considered to provide the most insight on the amplitude of the EMG signal since it gives a measure of the power of the signal, while producing a waveform that is easily analyzable.
This step-by-step blog will detail how to perform such a technique using EMGworks Analysis software and its built-in calculation tools, EMGscripts.
RMS Envelope Instructions:
- Open EMGworks Acquisition and setup your test configuration (sensors, test operator/subject, etc.). If you are unsure on how to do so, details can be found here.
- Within your configuration, there will be a toolbar on the left side of the program window. Select the Experiment Workflow header.
- Set up your desired amount of data collection runs, using the Plot and Store templates.
- Be sure to define the name, run time and sensors to be recorded from.
- Proceed and run the test configuration. Do this for all trials.
- Open EMGworks Analysis and import the trials you wish to perform the RMS envelope on.
- Highlight the run(s) you wish to perform the calculation on in the Data window, located on the left side of the program.
- Right-click within this window and navigate to Calculation Scripts → Root Mean Square.
- A parameter window will appear, detailing the window length and window overlap, both of which are user selectable.
- You can choose to remove the baseline offset by checking off the Remove Offset box.
- Select OK and the calculation will run in the background, appearing in the Data window when finished.
- Plot the RMS envelope by selecting and right-clicking the channels you wish to view. You have options to plot these separately, as subplots or overlaid with additional data.
- RMS computations are typically overlaid versus their raw EMG signals.
- You can change trace color and weight by right-clicking the plot and selecting Properties.
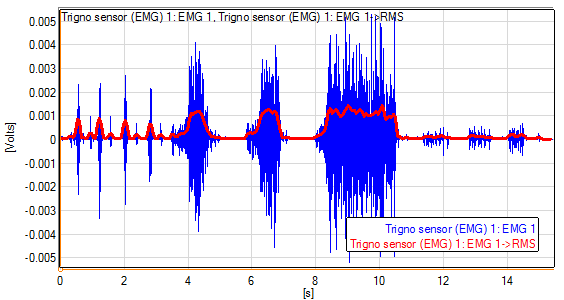
- Example plot of RMS envelope (RED) overlaying its raw EMG signal (BLUE).