Advanced Step 3 - Plotting the Data
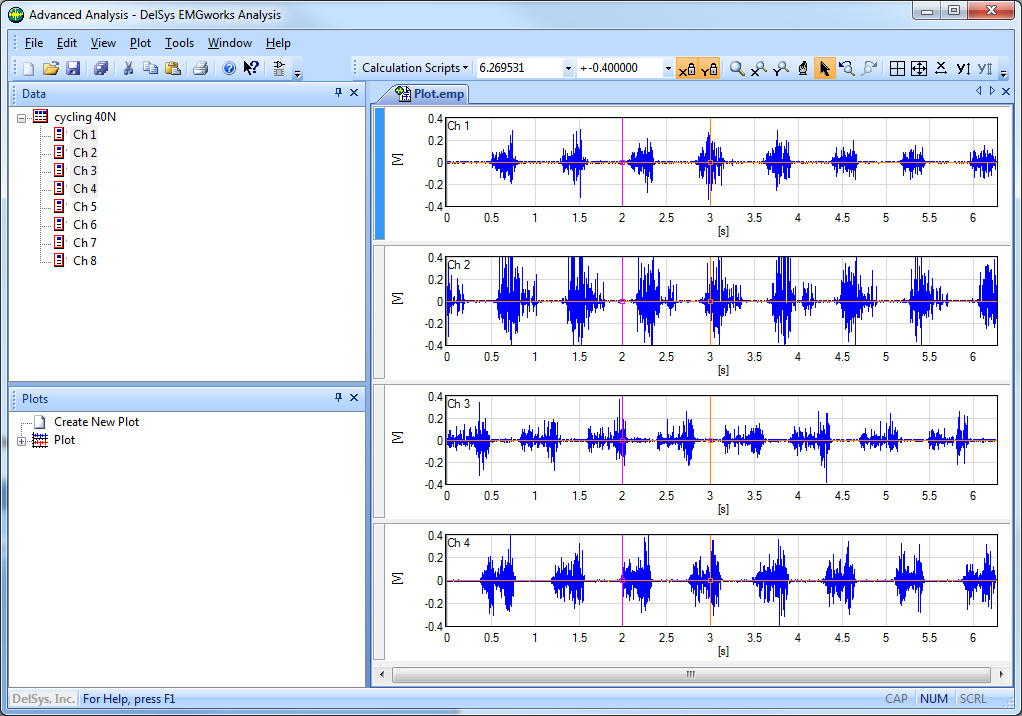
Before performing any analysis, the raw data will be plotted.
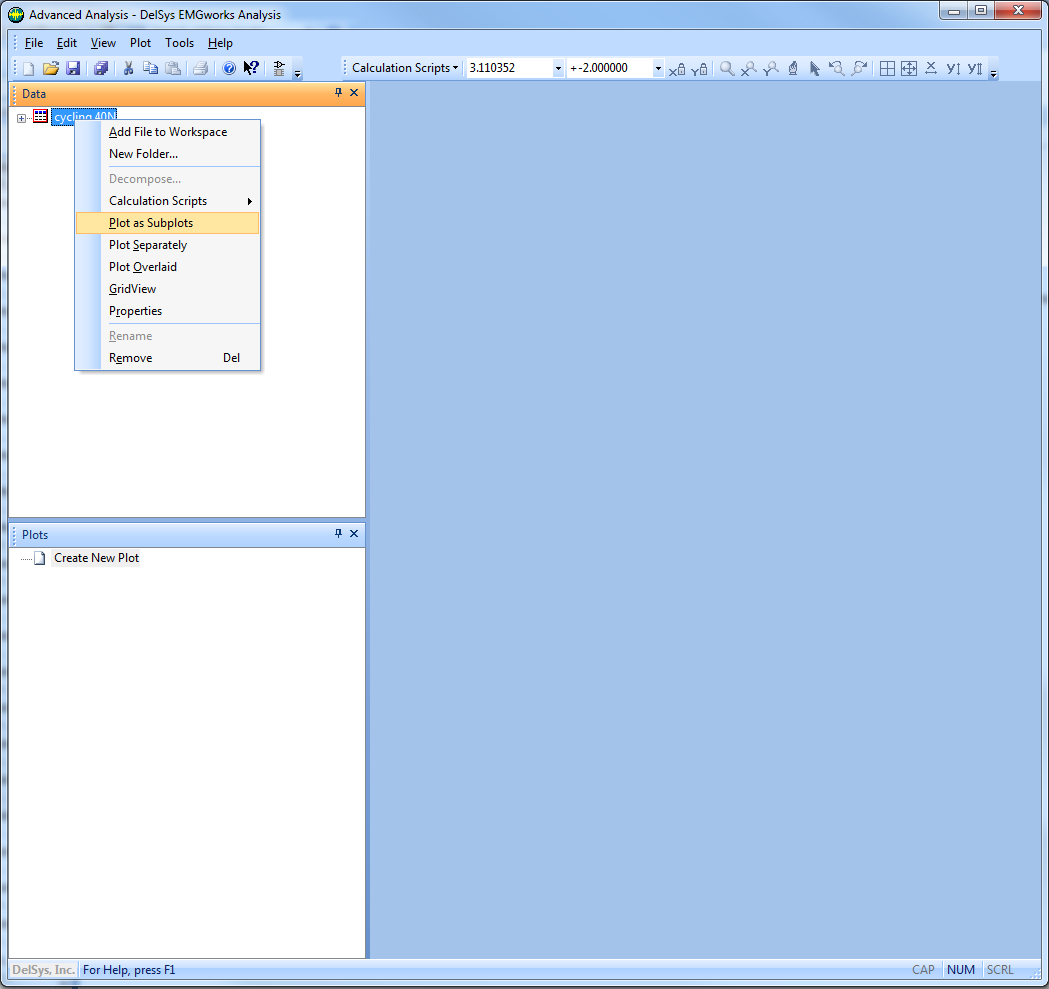
1. Right click on the selected data and select Plot as Subplots.
2. Right click on the plot
area inside subplot 1 and select Auto Scale. This
will set the ranges of the x and y axes to fit the data contained in this
plot. Since the x and y zooms are locked, ![]() , the two axes of the other
subplots will be set identically to those of the first subplot.
, the two axes of the other
subplots will be set identically to those of the first subplot.