Advanced Step 6 - Threshold Determination
The Quickview window will be used to determine an estimation of the parameters to be used in the THRESHOLD calculation. The goal of the threshold calculation is to determine intervals where the bursts of EMG activity exceed a desired threshold
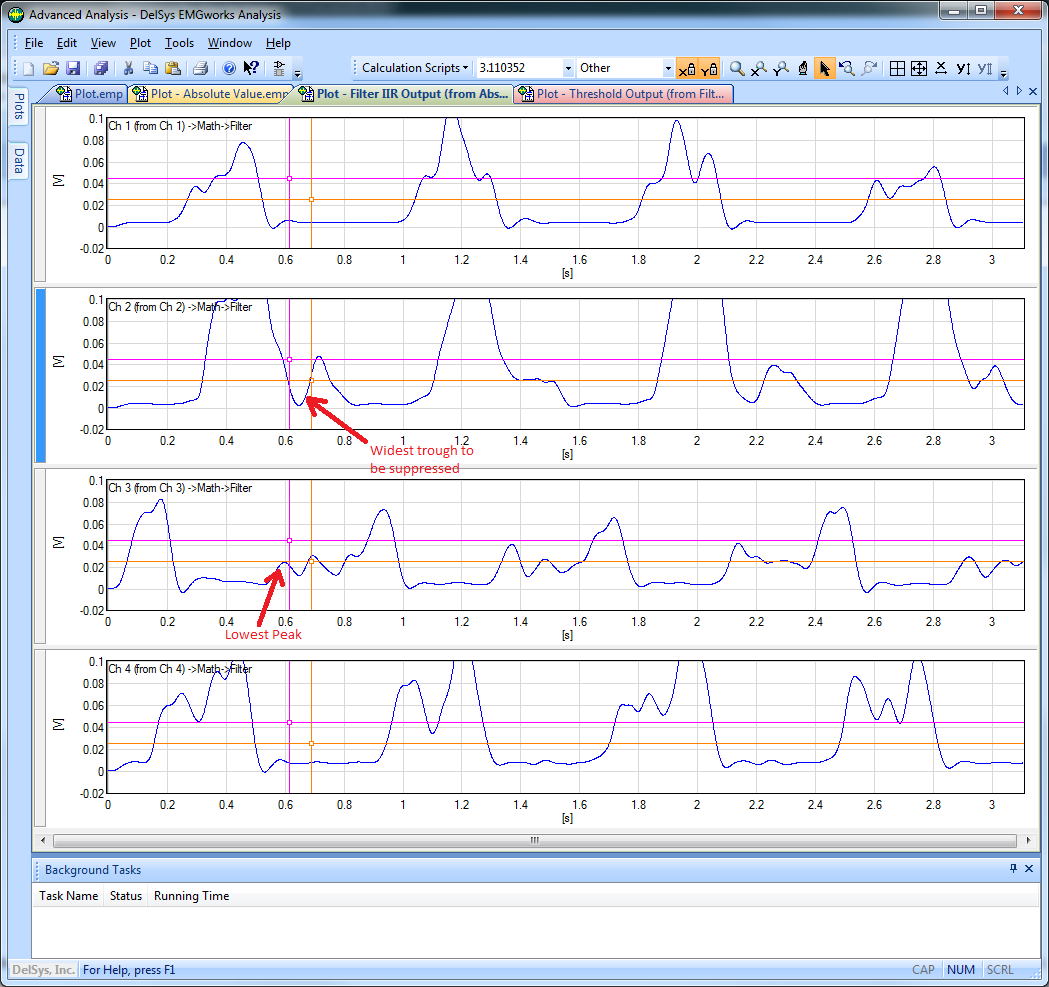
1. Choose View > Quickview from the Main Menu to show the Quickview window.
2. Select the third Subplot in the Plot and move the Y2 cursor to the height of the the smallest peak. Also move the X1 and X2 cursors to the two extremes of the widest trough that is below the Y2 cursor in the second Subplot.
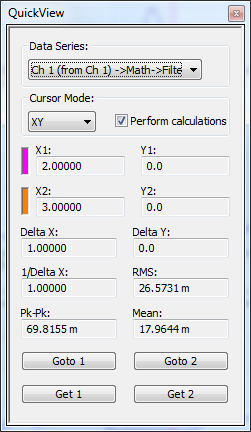
3. Now examine the values on the Quickview window.
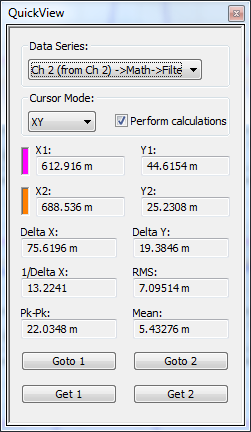
4. The Y2 value of 25.2 mV indicates the height of the Y2 cursor. This will be rounded to 0.025 and used as the Level for the Threshold calculation since this will assure that even the smallest peak exceeds the threshold. The Delta X value of 75.6 ms indicates the amount of time spanned between the two X1 and X2 cursors. This will be rounded to 0.07 and will be used as the Suppression Length for the Threshold calculation in order to make sure that the small peak after this trough is included with the large peak in the same threshold interval. Right click on the "Filter IIR Output" data file in the Workspace and choose Calculation Scripts > Threshold. For the Threshold Type parameter, select Fixed, and enter "0.025" for the Threshold Level. Check Suppress spikes/gaps and enter and "0.07" for the Time. Ensure that Rectify, Lowpass Filer (FIR), and Scale Output are not checked.
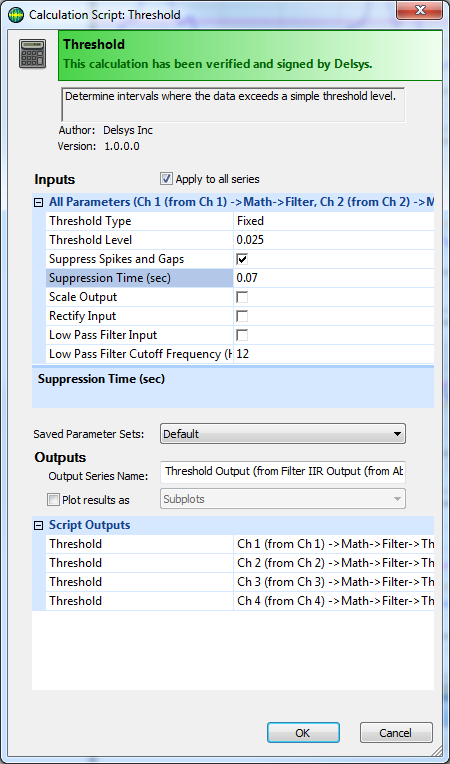
5. Click the OK button. The result will be added to the Workspace. Since the Plot Results box was not checked by default this time, the result will not be plotted. Right click on "Threshold Output" in the workspace and choose Plot as Subplots. Choose +/-2.0 from the Y-axis range pull-down menu on the Plot Bar.
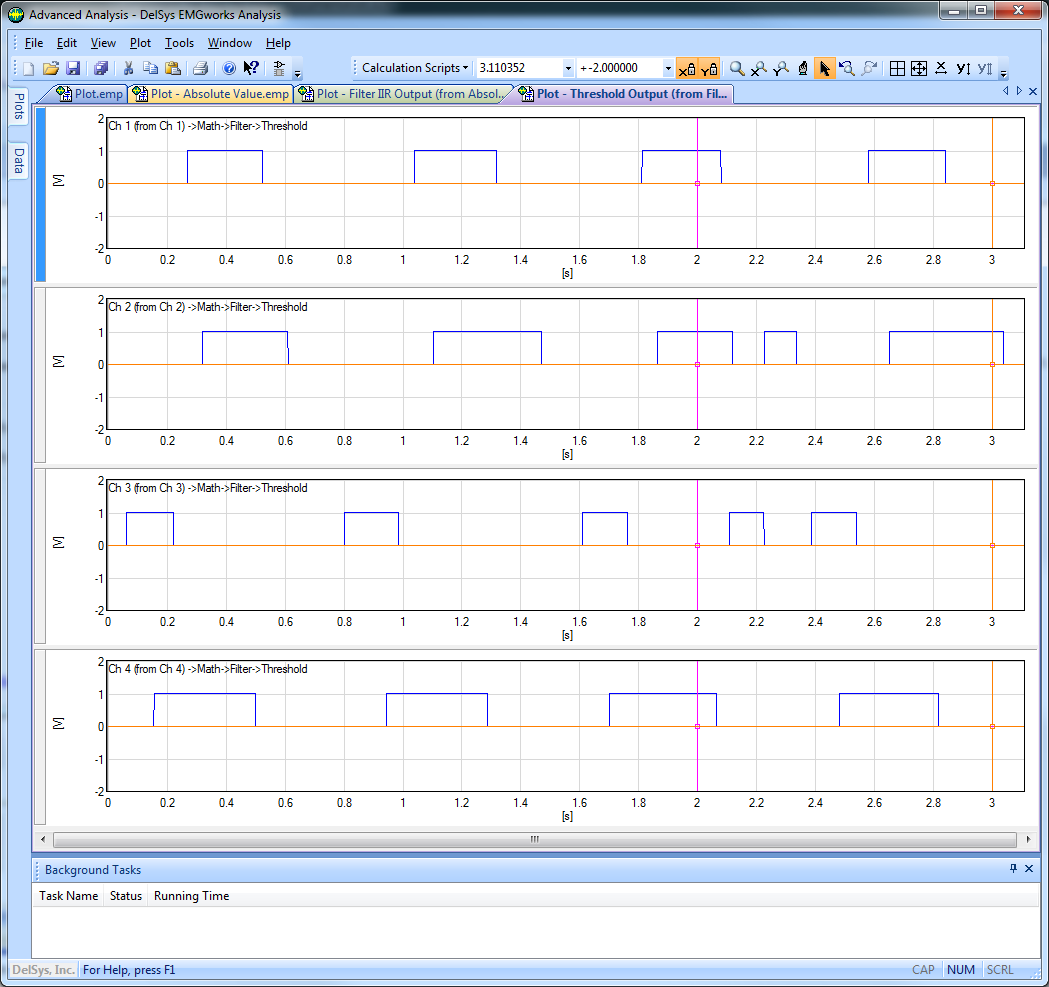
6. The blue rectangles indicate the time intervals in each of the Subplots in which the rectified and filtered EMG data exceeded the threshold value. The goal of the threshold calculation was to identify four events in each data series. With these parameters, a trough in event 3 of the second data series was not suppressed, and event 4 in the third data series was interpreted as two events because the threshold was too high. To rectify this, we will run the calculation again on the rectified, filtered data, as in Step 4 but adjusting the Suppression Time to .1 and the Threshold Level to .2.
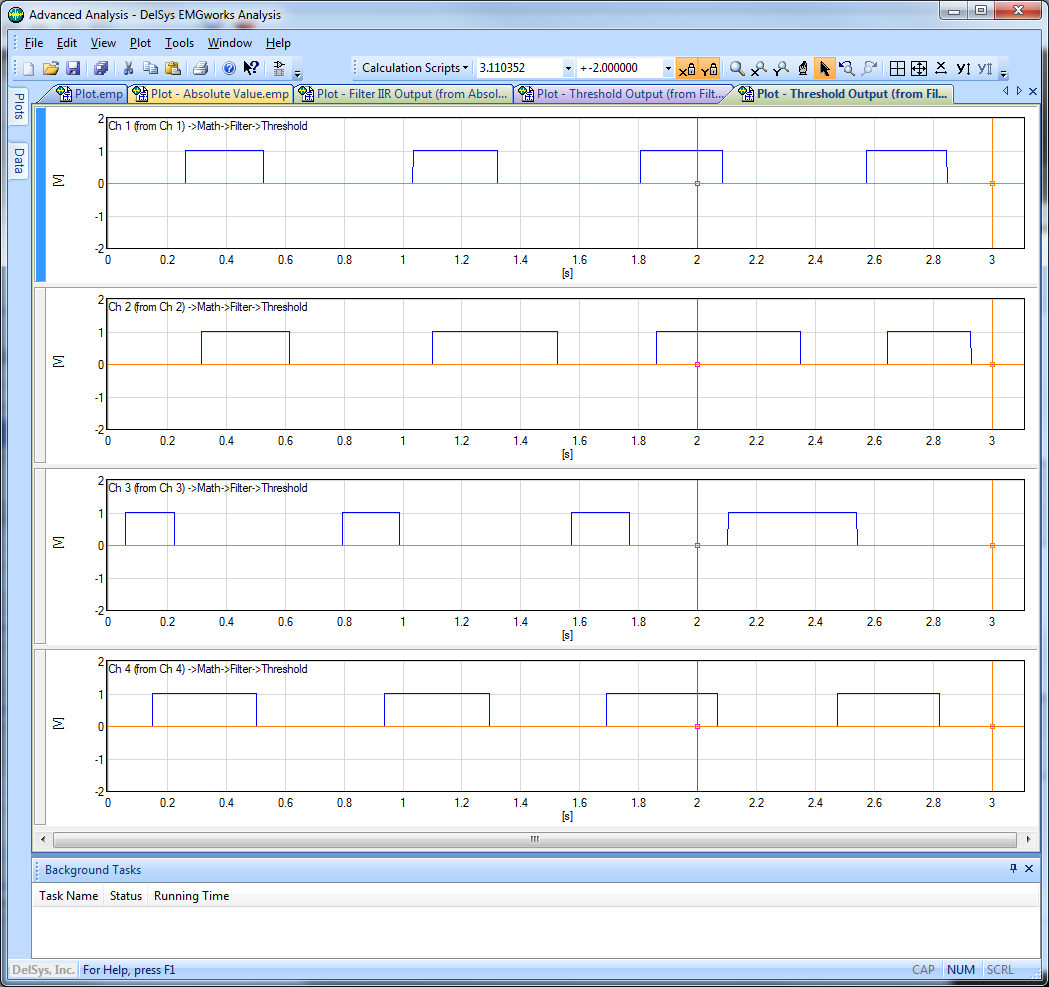
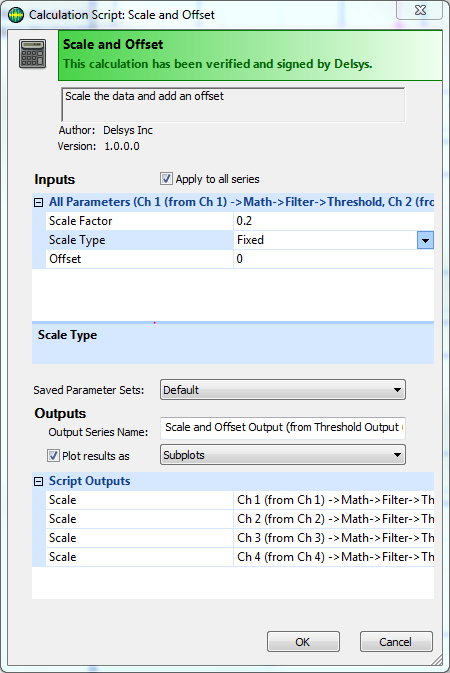
7. Now there are 4 clear events. In order to plot these events over the original data the threshold data needs to be scaled down. This data needs to be scaled so that when plotted with the original data, it fits it proportionately. For this purpose we will scale to .2 for all channels.
8. Right click on the "Threshold Output" data in the workspace and select Calculation Scripts > Scale and Offset. Enter a value of .2 for the Scale Factor, and select Fixed for the Scale Type parameter. Check the Plot Results box. Click the OK button.