Analyzing Data: Step 2 - Selecting the Series Defining Epochs
See the Cyclical Activity Analysis calculation for more information and images depicting the role of the SDE.
1. In this case we will use the impact filtered left foot sensor data (the X axis) for the SDE. Right click the data series "Left Foot Impact: ACC X 5->filter(Filter..." and select Plot Separately.
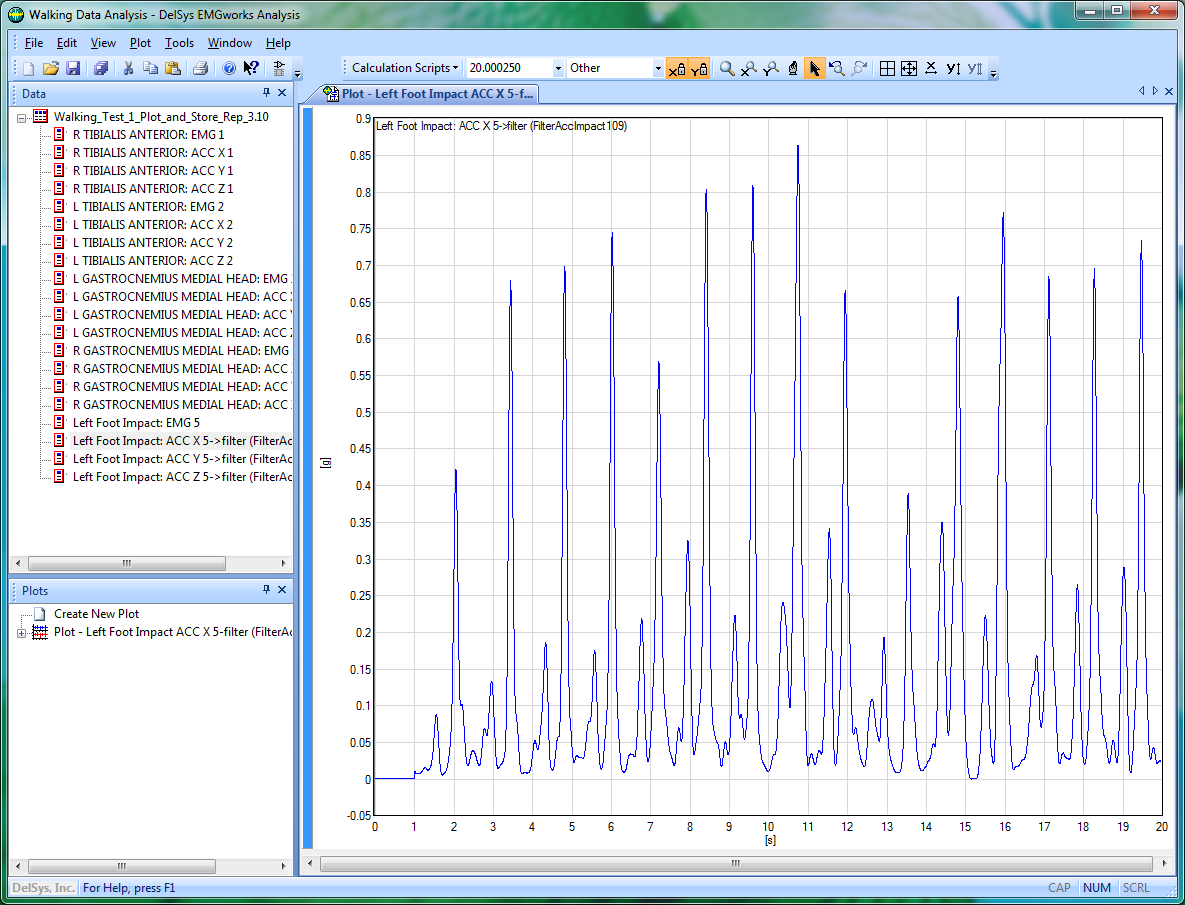
2. Each spike in the data represents the moment of impact between the left foot and the ground. A suitable threshold level must be determined, such that only relevant data is used. In this case we'd like to avoid using the data at the very beginning as well as in the period around second 13 where a normal gait cycle may not have been maintained. Here we will use the value 0.5 so that each gait cycle epoch is accurately defined. The next step is to perform the Cyclical Activity Analysis on the EMG data from the experiment.