Location
Pull down menu that specifies the location where the legend will be shown, if the above option is checked. A legend may be shown on the top or bottom right corners of the graph. The color of the traces and the legend background may be changed on the Colors tab.
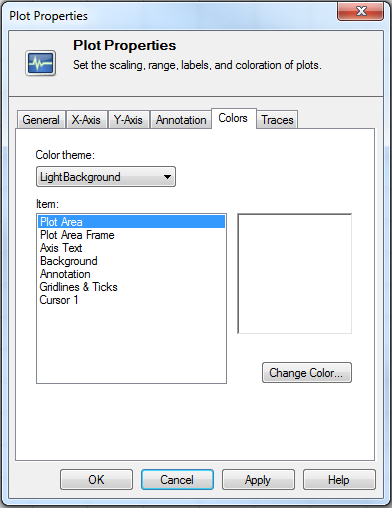
The Colors tab allows the user to specify preferences for the colors used in the Subplots. Color schemes can be selected from the pull-down menu. Two schemes are included, one for Subplots with dark background and one for those with light backgrounds. The user can also select "Custom" and change the colors of each of the components of the Subplots to suit presentation needs.
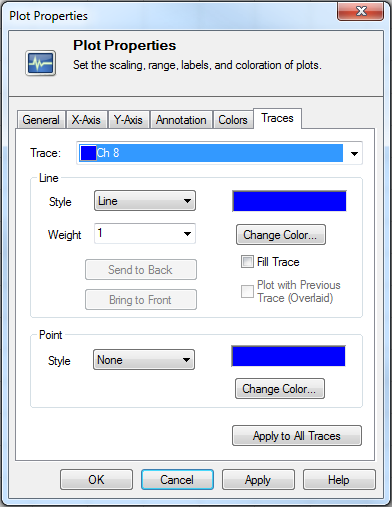
The Traces tab allows the user to change settings for the traces displayed on the subplots.