Creating a New Plot using the Plot Wizard
The Plot Wizard is the most complex way to create a plot in EMGworks Analysis, but it provides the greatest number of options for customizing the Plot. The Plot Wizard is entered by choosing Plot > Create Plot... from the Main Menu. After completing the instructions in each window, click the Next button to continue. It is also possible to return to the previous windows using the Back button. The wizard can be completed at any time by clicking the Finish button. The default settings will be used for the parameters that were not specified.
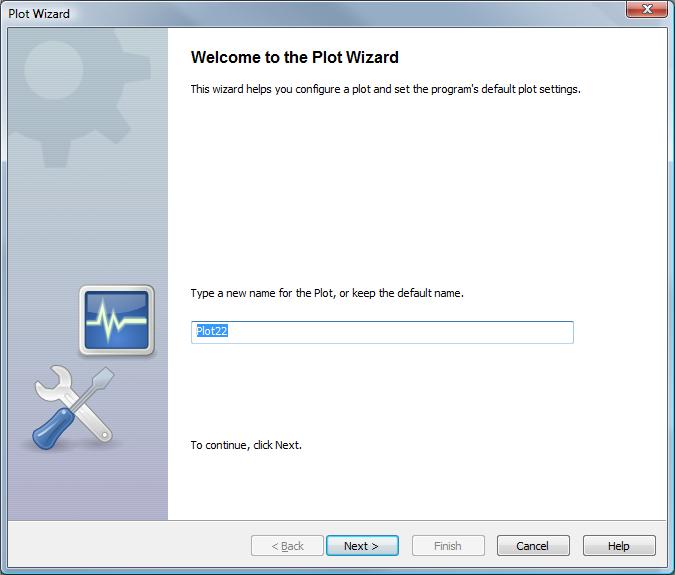
1. The Plot Wizard will appear with a suggested name for the Plot. The name is used for identification in the Workspace as well as the name of the Plot file in the Workspace folder. The name can be changed, as depicted below, to any unique name.
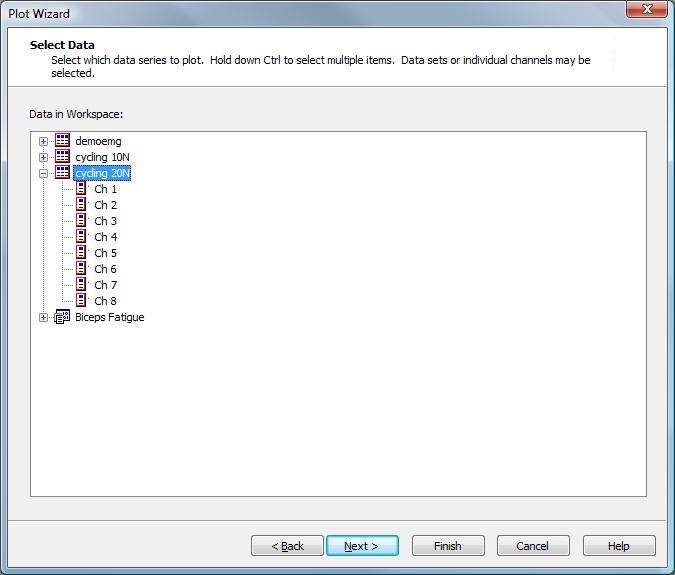
2. The Select Data window allows the user to select the Data Series to plot. Multiple Data Series from one or several Data Files can be selected by holding the <Ctrl> key while clicking on the Data Series. Selecting the parent of several series (e.g., "cycling 20N") is equivalent to selecting all the children ("Ch 1" though "Ch 8").
3. The Assign Data Series allows the number and positioning of subplots to be defined, and the data series can be assigned to these subplots. Additionally, the colors and axis settings can be set. Initially, the number of subplots will be selected to display one channel on each subplot. This initial layout can be cleared with the Remove All button.
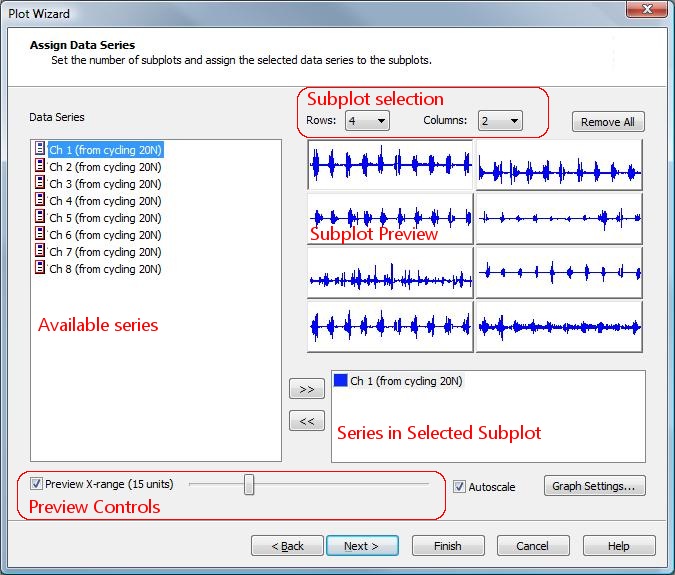
Available Series
This shows the list of data series which can be added to the plots. You can click or Ctrl-click to select a single or multiple series, respectively. A series can be added to just one, several, or all of the subplots. Double clicking a series will add it to the selected (depressed) plot. You can also add the selected series by clicking the >> button. It is not necessary to use all the available series in the subplots. For example, in the setup below, only Ch 1 and Ch 3 will be plotted.
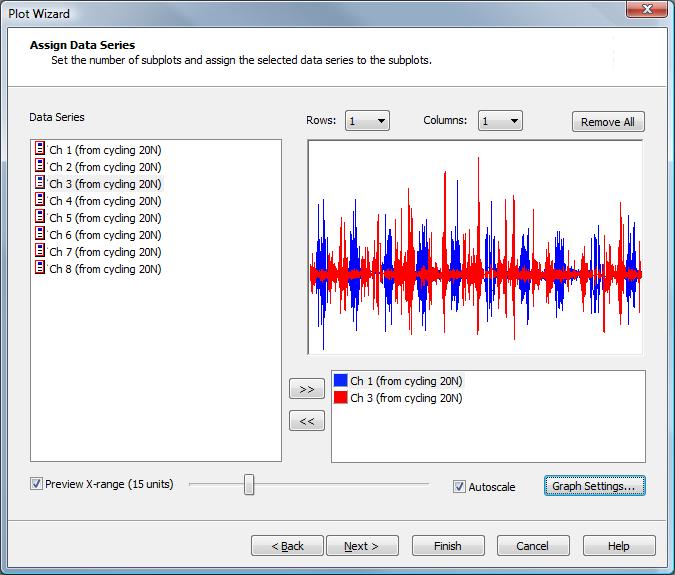
Subplot Selection
These drop-down menus control the layout of the subplot matrix which is produced. Each subplot must contain at least one data series. The subplot preview layout will change in real-time to reflect changes in these drop downs.
Remove All
Removes all series from all subplots in order to start out with a blank layout.
Subplot Preview
These thumbnails show a preview of what the created plots will appear as when the wizard is completed. A subplot is always selected and this subplot is displayed with a sunken border. All operations to add or remove a series will act on the selected subplot. The series contained in the selected subplot are displayed in the list box below the preview area.
Series in Selected Subplot
This list shows the series in the selected subplot. The icon represents the color of each series trace. You can click or Ctrl-click to select a single or multiple series, respectively. These series can then be removed from the subplot with the << button.
Preview Controls
These controls allow tuning the display of the subplot preview thumbnails. If Preview is unchecked, the preview thumbnails will not be displayed, and instead the number of series in each subplot will just be displayed. Moving the slider will cause the thumbnails to be regenerated showing the specified X-range of data. (If a series contains less data then the specified preview range, then only the range of data available will be displayed.)
Autoscale
If the box is checked, the Subplots will be autoscaled in the X and Y axes so that the minimum and maximum values of the Data Series lie within their ranges. This is not reflected in the preview.
Graph Settings...
Opens the Plot Properties dialog box, which allows labels, scales, gridlines, and colors for the Subplots to be specified.
4. The last window of the Plot Wizard allows the settings used in creating the current Plot to be used as the default settings. Whenever a Plot is created by any method, these settings will be used. This is done by clicking the check box as instructed.
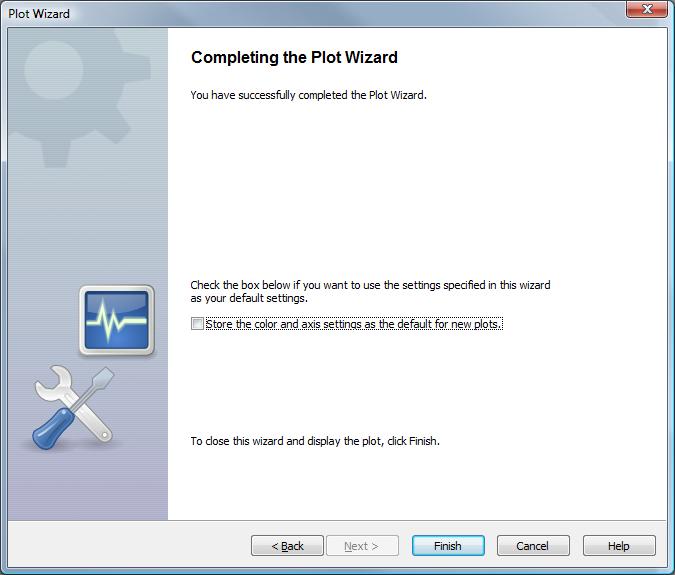
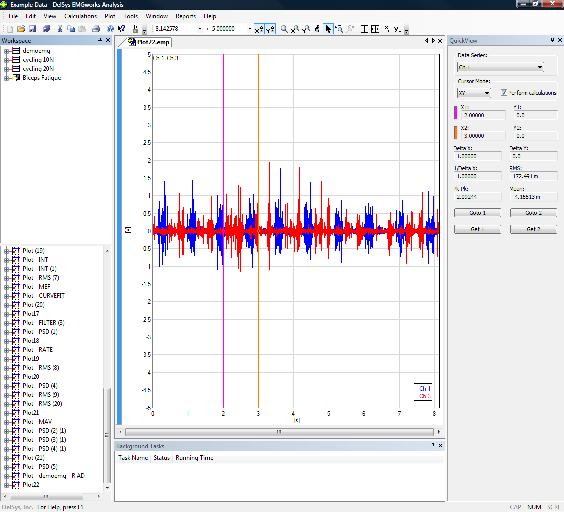
5. Click Finish to generate the Plot and add it to the Workspace. The specified Plot will appear in the work area and an icon will appear for the Plot in the Plot window of the Workspace as portrayed below.