Cyclical Activity Analysis
Data suitable for this report includes channels monitoring activity of a
subject during a repetitive activity accompanies by a channel that monitors the
beginning and end of cycles of repetition. For example, a foot switch
channel could be used to define cycles during a test involving a subject walking
or running. The cycle need not be limited to a cyclical activity of the
subject itself, but could extend to a course that the subject is navigating
multiple times (obstacle course, track, etc). In any of these cases, the
analysis would occur on the data collected from the subject, and would be
divided into cycles by the data collected from the foot switch or other Series
Defining Epochs (SDEs).
The cyclical activity analysis report determines the
average performance produced per cycle during a repetitive activity. It
defines a cycle either by user specified cycle-gap lengths or by a user
specified SDE. If an SDE is specified, its activation periods are
determined using a threshold calculation. Activation periods are defined
as periods during which the signal value is above a certain level. The
start times of these activation periods are recorded and used as the cycle
definitions. In figure 4 (below) the red line represents the threshold
level that determines the activation periods of the SDE. The second series
(green) is the data itself, from which we obtain the cycles, or epochs (numbered
1-12). If specified, the average length of a cycle (start time n to start
time n+1) is calculated, along with the standard deviation, in order to Remove
Outlier Epochs. Outlier epochs are defined as epochs whose length is
greater than two standard deviations different than the average epoch
length. As the figure shows, one epoch was thrown away in this case
(between epoch 8 and epoch 9) because it was greater than 2 standard deviations
longer than the average epoch length. The user can also choose to throw
away epochs at the beginning or at the end. In this case the specified
threshold did not select any data at the beginning or the end that we would like
not to include, so we will not choose to do this. 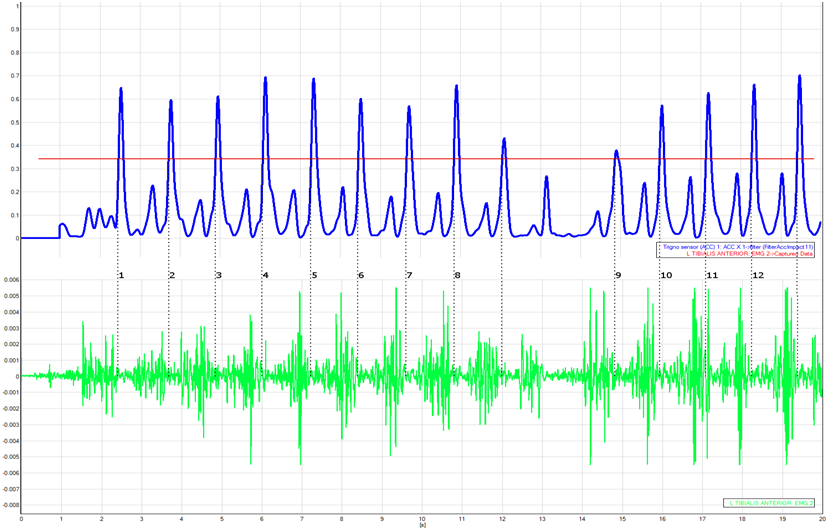
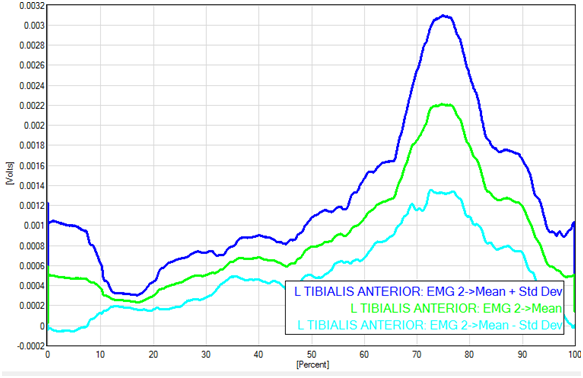
The remaining epochs are resampled to be the same length as the longest epoch (for the purpose of manipulation). The epochs are ensemble averaged, and the standard deviation computed.
If specified, the RMS of each input is calculated (including the SDE).
The result of this will be used for the rest of the analysis. This RMS is
calculated with a sliding window method using the user specified RMS Window
Length. The SDE channel is thresholded using the built in function
thresholdsplit (for more information on this function see section 7.11).
This function returns an array of start times of activation periods. If
the user specifies to Remove Outlier Epochs, the average length and standard
deviation is calculated and any epochs that vary from the average by greater
than 2 standard deviations are thrown out. As this calculation occurs the
start times of the epochs are multiplied by the ratio of the data’s sampling
rate to the sampling rate of the SDE, to guarantee that the start times align
properly with the data channels (If user does not specify to remove outliers,
this is done independently). After the outliers have been thrown away the
output Captured Data is calculated. This is a data series containing ones
and zeroes that corresponds to the input data channels. The purpose of
this output is to indicate which data was used and which was thrown out.
Figure 6 shows an example of the Captured Data output.
Using the built
in subset function, the epochs array is created by calling .subset(starts[i],
ends[i]-starts[i]), where starts is an array of epoch end times, and ends is an
array of corresponding end times (both are in samples).
The epochs are all
resampled to be equal lengths, using the longest length as the desired
size. This is accomplished using the .resamp(new_frequency) function, and
allows the epochs to be added together for the purpose of averaging (series of
unequal lengths are not allowed to be added together).
The code below
demonstrates the algorithm for computing the ensemble average of the
epochs.
var pMean = new Series(maxlength, maxlength/100);
var tmp =
0;
for(var j = 0; j < nEpochs; j++)
{
tmp =
epochs[j];
for(var i = 0; i < tmp.NumPoints; i++)
pMean[i] =
pMean[i] + tmp[i];
}
pMean = pMean.div(nEpochs);
This snippet iterates through each epoch in the array called epochs (length nEpochs), then iterates through the epoch and the series pMean adding them together pointwise. After this is complete, pMean gets divided by the number of epochs to create the average.
This average is then used to calculate the standard deviation. The standard deviation is calculated by the following loop (in a very similar manner as the average is calculated):
var pStdDev = new Series(maxlength, 1000);
for(var j = 0; j
< nEpochs; j++)
{
tmp = epochs[j];
for(var i = 0; i <
tmp.NumPoints; i++)
pStdDev[i] = pStdDev[i] + (tmp[i] -
pMean[i])*(tmp[i] - pMean[i]);
}
pStdDev =
pStdDev.div(nEpochs).pow(.5);
 Parameters